Experiment Name : Generation of a Standard Curve Using BSA by BCA Method
- kubratas1582
- 15 مايو 2025
- 5 دقيقة قراءة
Objective: To determine the concentrations of unknown protein samples by comparing them by establishing protein standards by BCA method.
Introduction: Determining the concentration of the protein obtained in protein purification methods is an important step. For this, the BCA method, which is a spectrophotometric analysis method, is widely used. This method is based on the reduction of Cu²⁺ ions to Cu⁺ ions as a result of the interaction of proteins with peptide bonds in an alkaline environment.
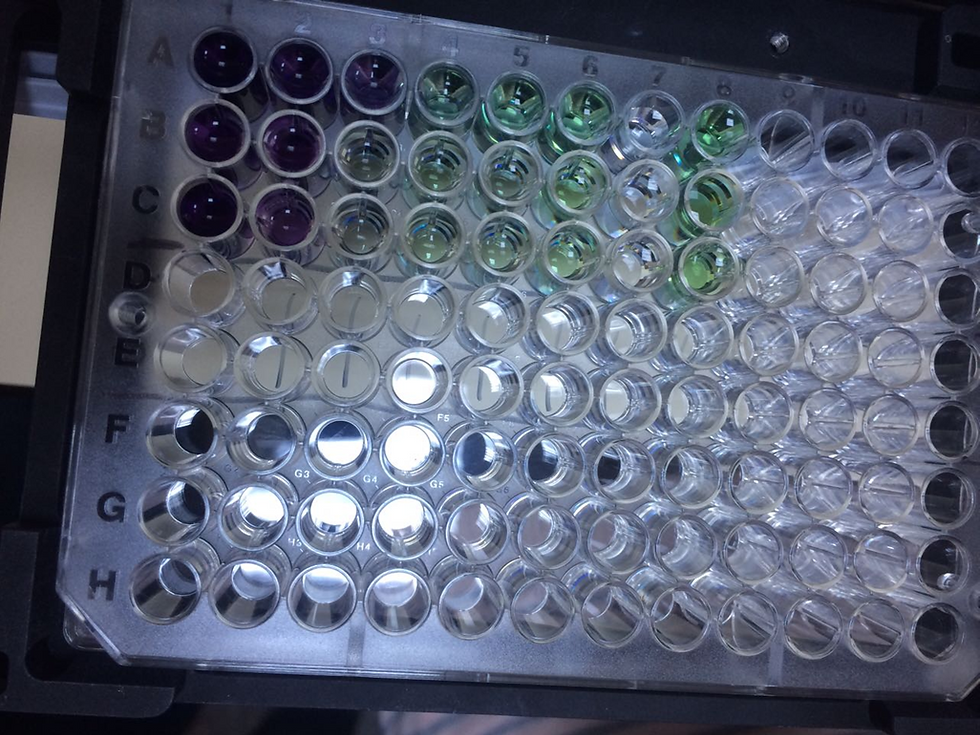
In the first stage, copper sulfate added to the alkaline BCA (Bicinchoninic Acid) Solution forms an apple-green complex. When this solution is added to a solution containing proteins, Cu+2 ions interact with the peptide bonds of proteins and turn into Cu⁺ ions. The amount of reduced copper depends on the protein concentration and incubation time. As a result, as a result of the reaction of proteins and copper (Cu + 2) ions, a purple-lilac color is formed and a purple solution with a maximum absorbance measurement value of 562 nm is obtained. The intensity (absorbance) of this color is directly proportional to the amount of protein.
It is similar to the biuret reaction in that peptide bonds and copper ions (Cu²⁺) interact under basic conditions. Although the BCA method follows a mechanism similar to the classical biuret reaction, it provides higher sensitivity and accuracy thanks to the colored complex formed by the bicinchoninic acid with Cu⁺ ions. It is a fast test (30 min.-24h.) and has high measurement accuracy. It is not affected by agents such as detergents and some organic solvents (urea and guanidinium chloride).
Materials:
1) a) BCA Reagent A: Sodium carbonate (Na2 CO3), sodium bicarbonate (NaHCO3), bicinchoninic acid, sodium tartrate (Na2C4H4O6), sodium hydroxide (NaOH)
b) BCA reagent B: % cupric sulfate (copper sulfate)
*Reagent A and Reagent B are used to observe color change.
2) BSA (Bovine Corn Serum Albumin) protein standard solution 2 mg/ml
3) Eppendorf Tubes
4) Microplate of 96
5) Micro Pipette and pipette tips
6) Incubator
4) Microplate reader
5) PBS
PBS (Phosphate Buffered Saline) solution: It is a buffer solution used to wash cells in blood or marrow samples taken for test and research studies.
8 g NaCl (sodium chloride),
0.2 g of KCl (potassium chloride),
0.2 g KH2PO4 (potassium dihydrogen phosphate)
1.15 g Na2HPO4 (disodium hydrogen phosphate)
Dissolved in 1 liter of distilled water and set pH to 7.2.
BSA (Bovine Bovine Serum Albumin): Bovine Albumin is used as the standard protein. In addition, this protein is also called Fraction V. BSA protein is made up of 604 amino acids. The signal peptide sequence consisting of 1.8 amino acids at the N thermal end of the protein is transferred from the precursor protein during secretion. Thus, it contains 589 amino acids. In addition, 4 more amino acids are extracted from this protein to become a mature BSA protein. As a result, there is a protein containing 585 amino acids
METHODS
1) Mark 6 Ependorf tubes from 1 to 6.
2) Prepare 6 standard solutions using PBS in 1/1, 1/2, 1/4, 1/8, 1/16, 1/32 dilutions from BSA standard solution with a concentration of 2mg/mL supplied with the BCA kit. We did our dilution with PBS solution.

3. The prepared standards will be 25 μl into the wells of the microplate
Pipette as shaped (use 3 wells for each standard).
4). For control purposes, add only PBS to the wells in row 7.
5.) Prepare the 50:1 ratio of Ragent A to Ragent B for a total of 5 mL. and add 200 μL to each well with samples. For control purposes, add only this mixture to the wells in the 8th row.

6.) Cover the prepared microplate with parafilm and incubate at 37°C. (30 min.)
7.) Turn on the microplate reader and set it to the desired program.
8) Bring the microplate removed from the incubator to room temperature. (Observe the color change).
9) Scan the microplate at 562 nanometers.

with exel


Table structure:
Columns 1–6: Probably unknown samples (or different concentrations).
A, B, C: 3 repetitions of the same sample (triplicate measurements).
AVG.: The average absorbance value of each sample.
According to these values, sample 1 has the highest amount of protein, while sample 6 has the lowest.


(A graph created with the protein ratios in the spectrophotometer (Linear))
📊 Chart Commentary:
On the X Axis: Concentration (mg/mL)
On the Y-Axis: Absorbance (measured color intensity – usually measured at 562 nm)
🔹 Linear Equation:
y=2.7511x+0.0038
This equation is the linear regression equation of the standard curve.
Y: Absorbance
X: Protein concentration
The equation tells us that:
Absorbance = 2.7511 × Concentration + 0.0038
🔹 R² Value:
R2=0.991
This shows how well the regression line fits the data.
The closer it is to 1, the better the fit.
0.991 is a pretty close to perfect value, → right, it fits the data very well.
Argument:
As can be seen:
The values are sorted in descending order from left to right.
This most likely indicates that the concentration has decreased or the samples have been diluted.
The measurements are very close → the reproducibility is good, a reliable experiment has been conducted.
The fact that the experimental repetitions (A, B, C) are close to each other shows that the experiment is reliable.
The R² value of the standard curve is 0.991, indicating that a linear relationship has been established. (This value reveals that the data show high agreement with the linear model. the closer it is to the value of 1, the better.
Values have plummeted, which is a good thing. Because it indicates that a dilution has been carried out.
However, while there are significant differences between the first three concentrations, the differences decrease at low concentrations such as 4,5,6. When the values are so close, the absence of a high difference between subsequent values indicates that the dilution ratio is not correct.
Possible reasons:
1. This may be due to pipetting. The protein may have been splattered.
2. At low concentrations, the measurement accuracy may be reduced.
3. It may be necessary to do more repetitions or consider device sensitivity.
4. However, if these differences still fit the linear curve and the deviation is not large, it is not considered a serious problem.
If necessary, more precise pipetting and additional repetitions may be recommended in this area.
In general, the results are as expected and successful.
Footnote: If the absorbances at both low and high concentrations were very close to each other, this would mean that:
Either the standard solution concentrations were not prepared correctly (all tubes have similar protein content),
Or the spectrophotometer measurements were not performed correctly (e.g. the instrument reached saturation or gave an error).
If there is no difference between samples with a particularly high concentration and low concentrations, the reaction may be incomplete or the amount of reagent may be insufficient.
In this case, the standard curve would not come out, or R² would be too low — that is, linearity would be lost.
In addition, this would be a serious mistake in terms of the accuracy and reliability of the BCA method.
Result:
In this experiment, protein amounts in various samples were successfully determined by BCA method. The standard curve was found to be reliable and the concentrations of the samples were calculated correctly. Despite the limited differences between the low concentrations, the accuracy of the experiment is satisfactory. With this standard curve, you can safely calculate the amount of protein in unknown samples. The BCA method is sensitive and reliable, especially for low-concentration protein samples.
Bibliography:
Smith, P.K., Krohn, R.I., Hermanson, G.T., Mallia, A.K., Gartner, F.H., Provenzano, M.D., Fujimoto, E.K., Goeke, N.M., Olson, B.J., & Klenk, D.C. (1985). Measurement of protein using bicinchoninic acid. Analytical Biochemistry, 150(1), 76-85.